top of page
Detroit
November, 2024
Minneapolis, MN
Jupyter Notebooks

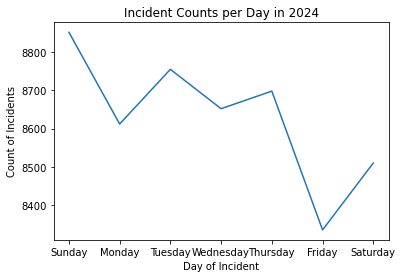
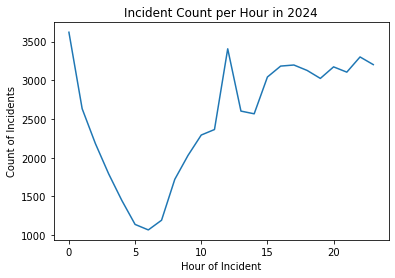


This set of charts and maps of Detroit, Michigan was created in Fall 2025 for my Principles of Geospatial Computing course (GEOG 5541) at the University of Minnesota. The charts show the changes in crime counts per day, month, hour and offense, while the maps show the crime count using various classification methods.
bottom of page